


The latest UDISE+ data highlights improvements in enrollment, retention, teacher availability and school infrastructure, while exposing regional inequalities, gaps in digital access and challenges in secondary education.
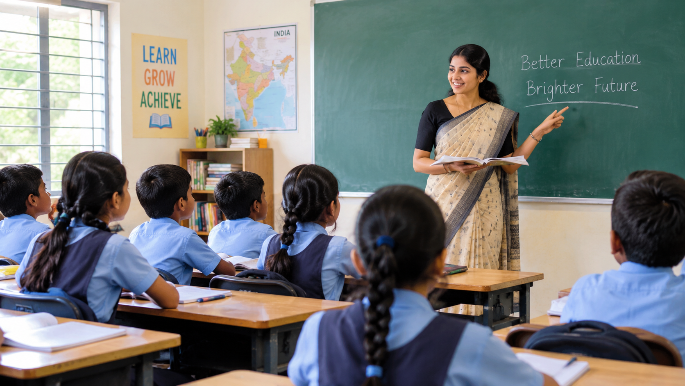
India’s school system is beginning to track more than who enters a classroom. It is increasingly measuring who stays, who drops out, who moves to the next stage, and what support each student needs to continue learning.
This shift is reflected in the Unified District Information System for Education Plus (UDISE+) Report 2025-26, released by the Union Ministry of Education in July.

Covering 24.72 crore students, the report offers a detailed view of India’s school education system, from enrollment and teacher availability to dropout rates, gender participation, infrastructure and digital access.
At the heart of this transformation is a nationwide student-wise database. UDISE+ began collecting individual student-level information from all recognized schools in 2022-23.
The system is intended to help authorities identify students who have dropped out, detect duplicate or ghost records, ensure government benefits reach eligible children, improve expenditure management and better understand individual learning needs.
The approach supports the National Education Policy (NEP) 2020, which places universal enrollment and regular attendance among the central goals of school education. The policy calls for students to remain enrolled, attend regularly and receive opportunities to return if they leave school.
A national database takes shape
India recorded 24.72 crore students across the foundational, preparatory, middle and secondary stages during 2025-26. The foundational-stage figures include Balvatika and pre-primary students in schools registered under UDISE+, but exclude enrollment at Anganwadi centers operated by the Ministry of Women and Child Development.
The database is also increasingly linked with Aadhaar. Around 22.3 crore students, or approximately 90.2% of total enrollment, voluntarily provided their Aadhaar numbers during 2025-26.
Andhra Pradesh and Lakshadweep recorded the highest Aadhaar seeding rate at 99.6%, followed by the Andaman and Nicobar Islands and Chandigarh at 99.2%. Puducherry recorded 98.6%, Haryana 98.5% and Maharashtra 98%.
However, the national average masks significant regional gaps. Meghalaya reported the lowest seeding rate at 35.3%, followed by Nagaland at 65.1% and Manipur at 69.2%.
Where schools and students do not align
India’s school infrastructure is unevenly distributed in relation to its student population. Uttar Pradesh, Madhya Pradesh, Rajasthan, Karnataka, Odisha, Andhra Pradesh, Chhattisgarh, Assam, Jammu and Kashmir, Uttarakhand, Himachal Pradesh and Meghalaya have relatively more schools compared with enrolled students, suggesting some infrastructure may be underused.
The reverse pattern is visible in Maharashtra, Bihar, West Bengal, Tamil Nadu, Gujarat, Telangana, Punjab, Haryana, Delhi and Kerala, where comparatively fewer schools serve larger student populations.
The imbalance becomes particularly important across educational stages. While the number of foundational and preparatory schools expanded following the Right to Education Act, the growth of secondary schools has not kept pace.
That gap can become a dropout risk when students reach higher grades and find secondary education less accessible. West Bengal, for example, has 78.9% of its schools at the foundational and preparatory levels but only 11.7% at the secondary level.
Chandigarh presents a stark contrast, with 83.7% of its schools at the secondary level and only 5.3% at the foundational and preparatory stages.
Girls gain ground
Gender participation continues to show gradual improvement. Girls accounted for 48.4% of total school enrollment in 2025-26, compared with 48.3% in 2024-25 and 48.0% in 2022-23.
The Gender Parity Index remained above 1 across all educational stages, indicating proportionately higher participation by girls than boys. For publication purposes, the ministry has included transgender student data within the “boys” category.
The teaching workforce has also become more female. Women represented 54.9% of all teachers in 2025-26, up from 54.2% in 2024-25 and 52.3% in 2022-23. The ministry said the increasing presence of female teachers can support more inclusive and gender-sensitive learning environments.
The report also records the social composition of enrollment. OBC students constitute 44.9% of the student population, followed by the General category at 27.5%, Scheduled Castes at 17.7% and Scheduled Tribes at 10%.
Minority students account for more than 20% of total enrollment. Among enrolled minority students, Muslims make up 79.4%, Christians 10.1%, Sikhs 7.1%, Buddhists 2.0%, Jains 1.3% and Parsis 0.1%.
More teachers, better ratios
India’s teaching workforce has continued to expand. The number of teachers reached 1,02,73,020 in 2025-26, an 8.3% increase from 94,83,294 in 2022-23. Teacher strength stood at 98,07,600 in 2023-24 and 1,01,22,420 in 2024-25.
The increase has been accompanied by improved Pupil-Teacher Ratios (PTR). In 2025-26, the PTR stood at 10 at the foundational level, 12 at the preparatory level, 17 at the middle level and 21 at the secondary level.
These figures are below the 30:1 ratio recommended by NEP 2020. Compared with 2022-23, PTR improved from 11 to 10 at the foundational level, from 14 to 12 at the preparatory level, from 18 to 17 at the middle level and from 23 to 21 at the secondary level.
A lower PTR can allow teachers to provide more individualized attention and strengthen classroom interaction. Yet regional differences remain. Chandigarh and Delhi have among the highest numbers of students per school while maintaining PTRs within Right to Education norms.
Ladakh, Mizoram, Himachal Pradesh, Sikkim and Meghalaya have fewer students per school, indicating potential scope to optimize infrastructure and teacher deployment.
Dropouts continue to fall
The decline in dropout rates is among the report’s most encouraging findings. At the preparatory level, the dropout rate fell from 2.3% in 2024-25 to 1.8% in 2025-26. The middle-level rate increased marginally from 3.5% to 3.6%, while the secondary-level rate declined from 8.2% to 7.0%.
The longer-term improvement is particularly striking at the secondary level. Its dropout rate fell from 13.8% in 2022-23 to 10.9% in 2023-24, 8.2% in 2024-25 and 7.0% in 2025-26.
At the preparatory level, the rate declined from 8.7% in 2022-23 to 3.7% in 2023-24, 2.3% in 2024-25 and 1.8% in 2025-26. The ministry attributed the trend to improved retention and initiatives aimed at keeping children engaged in education.
More students are staying
Retention has also improved, particularly at the middle and secondary levels. Middle-level retention increased from 82.8% in 2024-25 to 83.7% in 2025-26, while secondary-level retention climbed from 47.2% to 51.9%.
The secondary figure has risen steadily from 44.1% in 2022-23 to 45.6% in 2023-24, 47.2% in 2024-25 and 51.9% in 2025-26.
Middle-level retention also increased from 75.8% to 78.0%, 82.8% and 83.7% over the same period.
Foundational and preparatory retention, however, recorded marginal declines in 2025-26 after three years of improvement. Foundational retention fell from 98.9% to 98.5%, while preparatory retention declined from 92.4% to 91.1%.
The ministry identified the expansion of secondary schools as one factor behind the improvement in secondary retention.
The transition points improve
More students are also progressing from one stage to another. The transition rate from foundational to preparatory education increased from 98.6% in 2024-25 to 99.2% in 2025-26. Preparatory-to-middle transition rose from 92.2% to 93.8%, while middle-to-secondary transition increased from 86.6% to 88.3%.
The gains indicate that fewer students are being lost during key transition points, particularly the move into secondary education.
Secondary participation rises
The Gross Enrolment Ratio (GER), another key measure of participation, also improved at the secondary level. GER increased from 68.5% in 2024-25 to 71.7% in 2025-26, compared with 67.6% in 2022-23 and 66.5% in 2023-24.
Middle-level GER stood at 89.6% in 2025-26, compared with 90.3% in 2024-25.
NEP 2020 aims to achieve universal school education and a 100% GER up to the secondary level by 2030. The latest increase therefore marks progress toward a key national target.
The ministry noted that GER generally changes gradually and that longer-term trends provide a more meaningful measure of progress. A GER above 100% can result from overage or underage enrollment, interstate migration and demographic variations.
The digital divide narrows
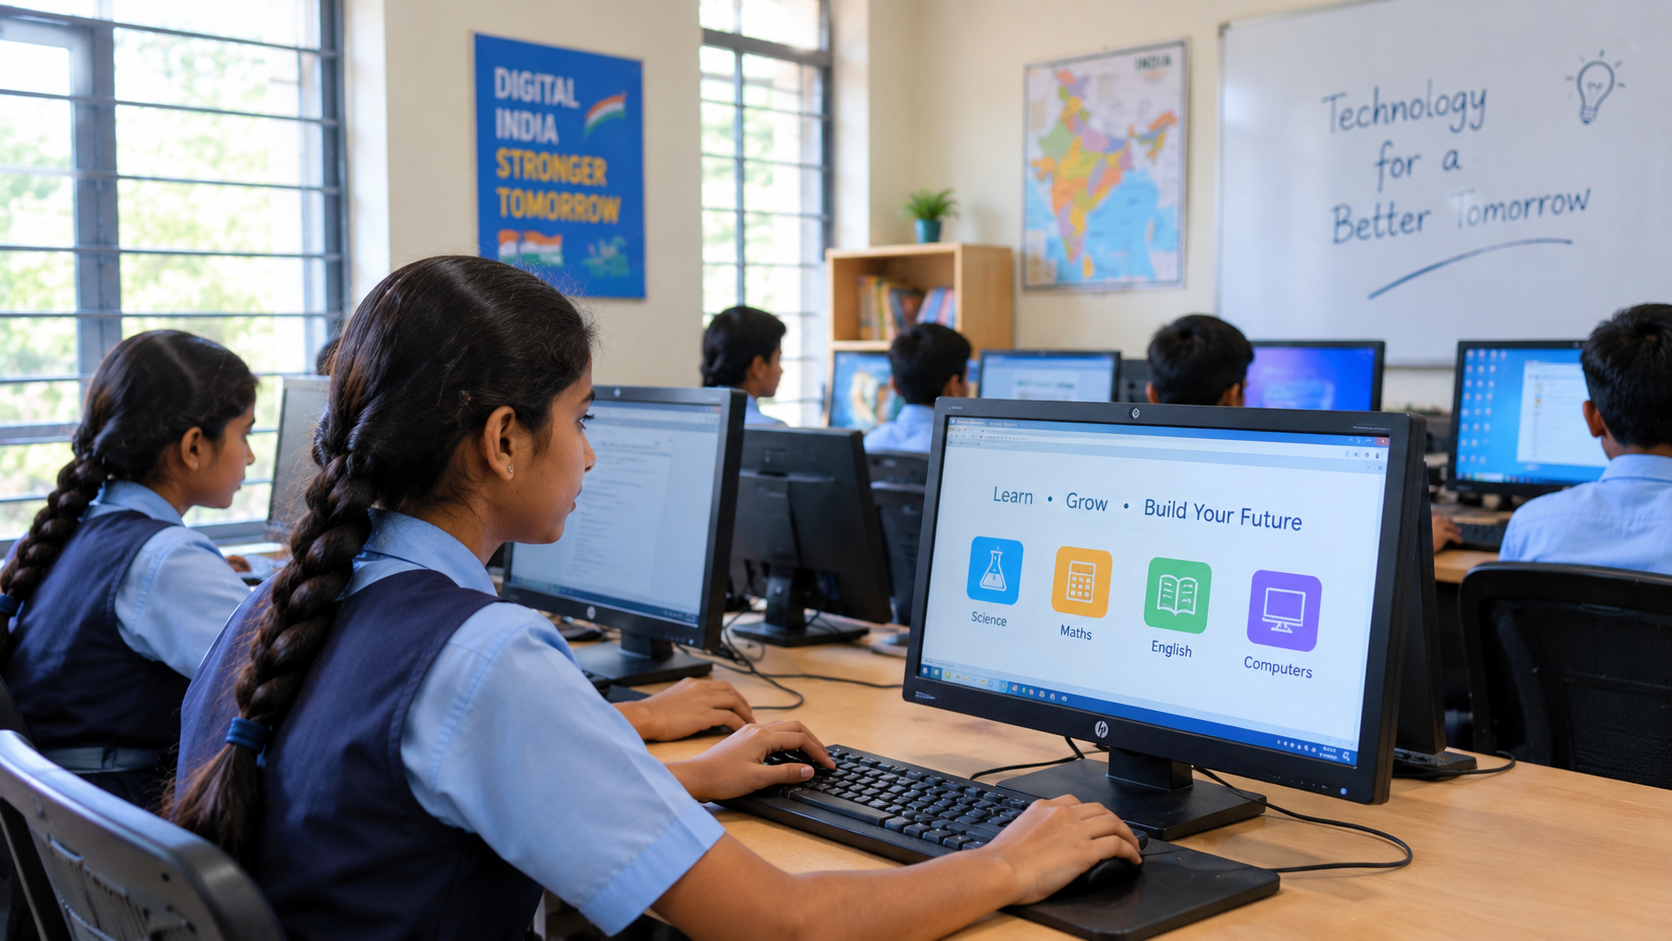
Digital infrastructure is expanding, although access remains incomplete. The share of schools with computer access rose from 64.7% in 2024-25 to 69.9% in 2025-26, while internet connectivity increased from 63.5% to 67.4%.
The expansion reflects efforts to integrate technology into classrooms and improve access to digital educational resources. However, roughly three in 10 schools still lacked computer access, while about one-third did not have internet connectivity.
Basic facilities show steady gains

Schools have also continued to improve their basic facilities. In 2025-26, electricity was available in 95.0% of schools, safe drinking water in 99.5%, girls’ toilets in 98.5%, boys’ toilets in 97.2% and handwashing facilities in 96.9%.
Library access increased to 90.5%, while rainwater harvesting facilities reached 29.9%. Playground availability, however, slipped from 83.0% in 2024-25 to 81.9%.
Around 58.2% of schools had ramps and handrails, an important step toward making education more accessible to students with disabilities.
The government has continued to support infrastructure improvements through the Samagra Shiksha Scheme, which provides financial assistance to states and Union Territories.
Fewer single-teacher and empty schools
The number of single-teacher schools fell by around 3% in 2025-26, from 1,04,125 to 1,00,843. Schools with zero enrollment declined by around 29%, from 7,993 to 5,663.
The figures can help authorities identify underutilized institutions and improve teacher allocation, although infrastructure rationalization must also consider the needs of children in remote and sparsely populated areas.
A more measurable education system
The latest UDISE+ report presents a school system showing measurable gains alongside persistent regional disparities. Teacher strength has crossed 1 crore, dropout rates have declined, secondary retention and enrollment have improved, and access to digital and basic infrastructure has expanded.
Yet the data also exposes unfinished work. Aadhaar seeding remains uneven, secondary-school availability varies sharply, digital access is incomplete and school utilization differs considerably across regions.
The larger significance of UDISE+ lies in connecting these indicators. By linking student-level records with information on teachers, schools, infrastructure, enrollment, retention and transitions, the system gives policymakers a clearer view of where students are progressing and where they are being lost.
For NEP 2020, the challenge ahead is therefore larger than simply getting children into classrooms. India must ensure that students stay, progress through each stage and have access to the teachers, infrastructure and technology needed to complete their education.

Rekha Sharma’s 40% Disability Certificate Disputed After Medical Board Reassessed It at 30%

Arctic Seals Face Rising Extinction Risk as Climate Change Accelerates Sea Ice Loss

India's Multi-Alignment Policy Faces Fresh Diplomatic Challenges

AI Model Can Identify Zero-Day Vulnerabilities in Critical Software

Patent Rejection Opens Possibilities for Generic Competition

Canada shifts focus to research talent as New Zealand targets growth in international education

Delhi to Attempt Artificial Rain Again as Pollution Chokes Capital; New Aircraft to Be Deployed

Want to speak Japanese with anime characters? Japan is developing an AI-powered language education app

Why are 3 in 4 Singapore parents turning to private tuition despite trust in schools?

Delhi-NCR schools go hybrid: Which classes are affected and what parents should know?

Rekha Sharma’s 40% Disability Certificate Disputed After Medical Board Reassessed It at 30%
Arctic Seals Face Rising Extinction Risk as Climate Change Accelerates Sea Ice Loss
India's Multi-Alignment Policy Faces Fresh Diplomatic Challenges
AI Model Can Identify Zero-Day Vulnerabilities in Critical Software
Patent Rejection Opens Possibilities for Generic Competition
Canada shifts focus to research talent as New Zealand targets growth in international education
Delhi to Attempt Artificial Rain Again as Pollution Chokes Capital; New Aircraft to Be Deployed
Want to speak Japanese with anime characters? Japan is developing an AI-powered language education app
Why are 3 in 4 Singapore parents turning to private tuition despite trust in schools?
Delhi-NCR schools go hybrid: Which classes are affected and what parents should know?
Copyright© educationpost.in 2026 All Rights Reserved.